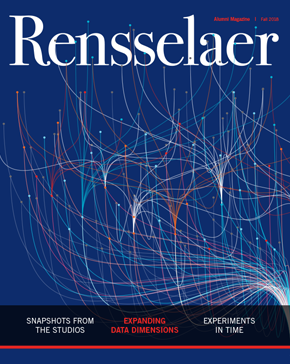


Expanding Data Dimensions
Researchers at Rensselaer are perfecting network analysis, a powerful data science technique that makes it possible to identify common ground in complex datasets.
by Mary Martialay
Ahmed Eleish, a doctoral student, types a few commands into his laptop, gives a final click, and sits back. The screen shifts abruptly from the rigid grid of a paleobiology spreadsheet to thousands of multicolored dots connected by a web of lines. In a dance choreographed by algorithms, the dots — representing records of trilobite fossils, color-coded into eight biological orders — shiver and shift position, while the web of lines, showing who was found near whom, follows the movement.
Minutes later, when the last of the shivering circles has come to rest, a pattern has emerged. Distinct clusters of dots connected by lines make apparent a truth, a relationship between factors that is hidden in spreadsheet data too voluminous to be processed by the human mind alone. The dots have clustered into “communities” of trilobites that lived near one another. Although there's no time axis, the passage of 300 million years is visible in the steady left-to-right shift in colors, as order marked by red circles gives way to yellow, then green, then blue. An abrupt choke point marks a mass extinction — followed by a smattering of blue dots.
This is network analysis, a powerful data science technique that makes it possible to identify common ground in complex datasets. Network analysis is best known in its guise as “social network analysis” — companies like Facebook use it to generate “friend” suggestions based on commonalities found in our profiles — but in the hands of Rensselaer researchers, it is drilling into the big data log jam. In many fields of research, traditional data analysis is limited to exploring relationships between two variables. By looking for communal relationships, network analysis can search for patterns in the interplay of as many as 10 variables simultaneously.
“Just as we think of people in terms of communities, with groups of common attributes — location, gender, interests — we can find communities in datasets, whether it’s fossils, minerals, or materials,” says Peter Fox, a data scientist, Tetherless World Constellation Chair, and professor of earth and environmental sciences, computer science, and cognitive science. “Thinking of community, or as we call it, ‘co-occurrence,’ gets you out of two dimensions, out of x/y plots, and that opens up enormous territory for pulling complex relationships out of data,” he says. “This idea has been in the mathematics and computer science literature forever, but advances in technology have only recently made it practical.”

The history of life on Earth makes a good example. With network analysis, researchers in Fox’s lab coaxed a massive database containing marine fossil records — with information including location the fossils were found, age of the fossils, and Linnean classification — into quantifying the ecological impact of five mass extinctions known to have occurred over the course of 542 million years.
Understanding Early Earth
The analysis, with results published in the Proceedings of the National Academy of Sciences, is the most ambitious thus far in the ongoing Deep Time Data Infrastructure (DTDI), a collaboration aimed at understanding the intertwined evolution of mineralogy and biology beginning with early Earth. Rensselaer provides the primary data science expertise for the project, headquartered at the Carnegie Institution for Science, and involves about 30 scientists. The goal is to integrate and explore existing discipline-specific data (the project website lists “mineralogy and petrology, paleobiology and paleontology, paleotectonics and paleomagnetism, geochemistry and geochronology, genomics and proteomics, and more”) to produce insights into the evolution of Earth’s environment.
The trilobite analysis was an offshoot of that work. An earlier DTDI network analysis produced a time-lapse visualization depicting how minerals bearing cobalt — a rare element essential in life — changed in composition as oxygen proliferated in Earth's atmosphere. The results contribute to our understanding of how biology incorporated cobalt from 4 to 2 billion years ago. Prior to that, a DTDI network analysis of similar data showed which minerals in specific classes (such as copper- or chromium-bearing minerals) are likely to be found in proximity to one another.
“Network analysis is a tool for data-driven science. We have guiding scientific questions, but we’re typically not applying an analysis just to prove or disprove a hypothesis,” says Eleish. “Instead we are exploring the data. We work with experts to identify their purpose and then we apply a data-driven approach to help them explore the data and find relationships, patterns, and trends that might be interesting to them.”
The roster of the projects currently underway in the lab (numbering more than two dozen) includes seemingly unrelated research — one project explores extremophiles while another is focused on metal additive manufacturing — that hints at the breadth of fields where the approach may be productive.
Student-Led Research
Most of the students and postdoctoral researchers in Fox’s lab have their fingers in multiple projects, with anywhere from two to half a dozen researchers teamed up on each project. Many of the projects involve network analysis, which makes sense given that the technique combines the fundamental elements of the lab — structuring data and establishing best practices for data, statistical analysis, machine learning models, and data visualization. While network analysis is only one of a suite of tools the lab uses to pry knowledge from numbers, for the moment, it is the star player.
For example, postdoctoral researcher Fang Huang is leading a network analysis effort on two similar projects — the Census for Deep Life and Cerro Negro — aimed at understanding how environment affects biology. The Census for Deep Life uses datasets on life found under the surface of the Earth, principally in the deep ocean. The Cerro Negro project — a collaboration with Karyn Rogers, assistant professor of earth and environmental sciences — looks at a dataset on extremophiles taken from a volcanic mountain in Nicaragua.
Doctoral students Hao Zhong, Congrui Li, and Feifei Pan, working with Johnson Samuel — associate professor of mechanical, aerospace, and nuclear engineering — are using network analysis as part of a larger project to advance the field of metal additive manufacturing, better known as 3D printing.

And Anirudh Prabhu recently launched a project to adapt network analysis to small datasets, an idea that stemmed from the Mars Curiosity mission. The CheMin instrument aboard the Curiosity rover collects images of minerals which are used to calculate the crystal lattice dimensions of the minerals. Multiple competing methods exist to calculate the chemical composition of the minerals from the limited image data collected on the crystal lattice dimensions, but no single method is acknowledged as superior. The dataset is small, but Prabhu wants to develop algorithms and practices that will enable him to explore it and gain some valuable insights.
“I keep thinking we are going to hit a wall with network analysis, that we’ve done all we can with it. And every time I work on something new, it surprises me, and I’m impressed that we gained a new insight,” says Prabhu, a doctoral student. “Network analysis is so versatile in the things that it can do; it can be transferable through domains, and it can be scaled up and scaled down for the kinds of analysis that you want to do.”
In each case, the network analysis maps a structure formed by “nodes” that represent the object of study (a fossil, an extremophile, a metal) and “edges,” which express a significant relationship that can exist between nodes. In the simplest example, researchers begin with an existing dataset in spreadsheet form, create a separate spreadsheet listing the nodes to be found on that dataset, and connect the two spreadsheets with code that defines the edges, and generates graphs of the structure formed by the nodes and edges. Variables can be encoded into the nodes — with options like color, size, and shape to indicate the variables — and edges. Additional types of nodes (fossils and locations) allow more complex networks. Most of the work is done using open source tools, packages, and libraries, like RStudio, Python, and Jupyter.
Data scientists will tell you there is a known distribution to their work: 80 percent data curation, 20 percent data exploration. Every analysis starts with the long work of combing through databases, structuring data, unifying terminology, and establishing best practices. There are also, says Prabhu, decisions to be made, usually as part of a conversation between the data scientists and the discipline-specific experts.
“Sometimes, when we explore the data that is given to us, we can say ‘these datasets have varied distribution, lots of complexity, they have the most to tell us, so it would be worth exploring them,’ ” says Prabhu. “And sometimes experts say ‘these are the research questions that we are most invested in and what can you do to help us?’”
Problem-Solving Methodology
The work is rooted in a methodology that Fox, who began his career as an applied mathematician, developed through multiple collaborations, including his work with Tetherless World Constellation colleague Deborah McGuinness. This methodology — a progression of 11 steps that includes developing a “use case,” developing a model ontology, adopting a technology approach, and frequent evaluation — makes it possible for them to rapidly replicate their work, moving among datasets from different disciplines and extracting meaning from graph representations without coding exhaustive discipline-specific knowledge.
“What I really bring is a conceptual representation of how to solve problems,” says Fox. “I’ve developed courses to teach students the skills they need to follow that methodology. They know that you have to conceptually understand the problem, you have to understand the terminology, you have to understand the research goal or question. And then you have to be prepared to apply software engineering techniques like rapid prototyping, and spiral development, and social science methodology.”

Fox has worked on about 10 different fields in the past three decades, devoting increasing time over the past 15 years to applying data science techniques and computer science techniques to developing data science computer platforms. Much of his earlier work — like a traceable account system he built for the Global Change Research Program in 2012 and a system developed for NASA that allows researchers to rectify data from multiple NASA satellites in different flight patterns collecting different data — established best practices for structuring and storing data and representing its quality. His research group serves as the data science team for the Deep Carbon Observatory (DCO), a 10-year-long collaboration of more than 1,000 scientists studying the "quantities, movements, forms, and origins of carbon inside Earth."
Large projects like the DCO often spawn subgroups, and the Deep Time Data Infrastructure is a prime example. Observing the practices Fox and his team employed in the DCO, Carnegie Institution scientist Robert Hazen approached the team to suggest a similar collaboration based on mineralogy. Hazen, says Fox, was looking to make the transition from spreadsheets, two dimensions, and incremental progress, to multiple dimensions and breakthroughs.
The team sought funding with the W.M. Keck Foundation. In a rare move that recognizes the value of the approach, Keck asked the team to increase the budget by 40 percent. The project to date has been so successful, Fox says, that team members are now looking to expand its reach and lengthen its duration along the lines of DCO.
“This is groundbreaking work, and that’s what I came to Rensselaer to do,” says Fox. “Network analysis is only one of the tools in our methodology, but it’s proving extremely effective. It gets us out of two dimensions and exploring the full meaning of what the data has to offer. It’s useful in any field that has a notion of co-occurrence, of community. I think this is just the beginning.”

Written by Mary Martialay